2020-2050 Metropolitan Transportation Plan (MTP)

The 2020-2050 Metropolitan Transportation Plan includes projections through the year 2050. It was adopted by our Community Advisory Committee, Transportation Advisory Committee, and Transportation Policy Committee in May 2020, becoming effect on July 1, 2020. It was amended in September 2021 through Resolution T-9-21 and September 2022 through Resolution T-9-22.For more information on what a Metropolitan Transportation Plan is, please click here.

2020-2050 MTP Amended on September 8, 2022

To support the development of the proposed Intel site and the resulting regional growth, state and local agencies have committed to advancing area roadway network improvements. The 2020-2050 Metropolitan Transportation Plan was amended by Resolution T-9-22  to incorporate the corridor information resulting from the planned state and local Intel-related investments. More information can be found here. Due to the significance of the changes to the MTP, it is federally required to do an analysis to confirm the projects included in the amended MTP do not lead to violations in the air quality standard or delay obtaining the standard.  This is called a conformity determination. The incorporation of the projects in the amendment into the conformity analysis has been completed. A summary of this analysis is available here. The MTP documents have been updated to reflect the amendment.

More on the MTP

The plan is based on six regional goals. Objectives, performance measures, strategies, and projects have been identified for tracking progress in achieving the goals. The following is a breakdown of the MTP by chapter:

Projects Webmap

We have identified transportation needs and projects located within MORPC’s transportation planning area. Various project types are included

Regional Goals

The regional goals will guide the development of the MTP and give direction to investments in the regional transportation system.  These goals represent six broad visions, which will each be measured by objectives, measures, and targets. The goals were adopted by resolution of the MORPC Transportation Policy Committee, with approval of both the Community Advisory Committee and Transportation Advisory Committees on September 13, 2018, following a public comment period.

Through transportation:

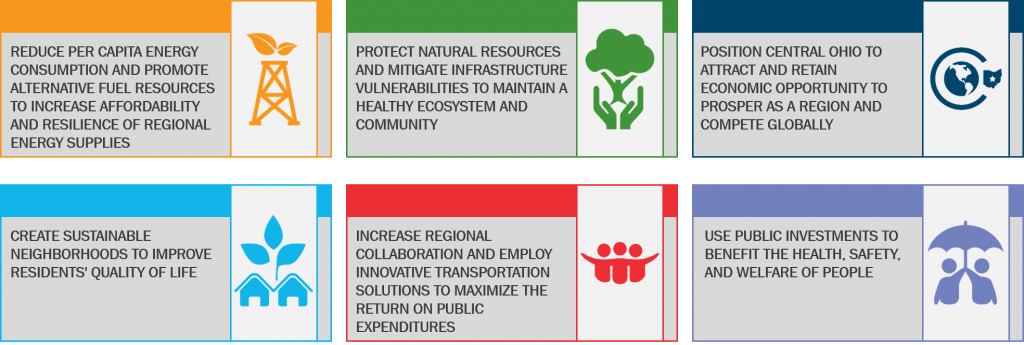
The progress of achieving each goal will be measured by several objectives. Two to five objectives have been identified for each goal. Objectives were chosen to measure certain aspects of each goal that can be impacted through transportation or the transportation system, and are based on data availability and measurability. For each objective, the existing condition, or benchmark, is documented and used to establish a short- and long-term target (years 2025 and 2050). The region’s progress toward reaching these targets will be reported on annually.

Objectives & Performance Measures

OBJECTIVE: Reduce the percentage of commuters driving alone, and increase the percentage of commuters riding transit, bicycle, or walking
Rationale 2020 MTP Benchmark 2025 Target 2050 Target
Reducing single occupancy auto commutes and increasing commuters using alternative transportation modes will reduce per capita fuel and energy consumption.
  • 82% of commuters drive alone
  • 6% of commuters ride transit, bicycle, or walk
2012-2016 American Community Survey
  • 80% of commuters drive alone
  • 7% of commuters ride transit, bicycle, or walk
  • 75% of commuters drive alone
  • 10% of commuters ride transit, bicycle, or walk
OBJECTIVE: Reduce vehicle miles traveled (VMT) per capita
Rationale 2020 MTP Benchmark 2025 Target 2050 Target
Reducing vehicle miles traveled per person for any trip purpose will reduce per capita fuel and energy consumption.
  • 9,300 vmt per capita
2017 ODOT VMT, 2018 MORPC Population Estimates
  • 8,800 vmt per capita (5% reduction)
  • 6,500 vmt per capita (30% reduction)
OBJECTIVE: Increase the percentage of vehicles using alternative fuels
Rationale 2020 MTP Benchmark 2025 Target 2050 Target
Increased use of alternative fuel vehicles is a direct measurement of alternative fuel usage.
  • XX% of registered vehicles use alternative fuels*
  • 0.23% of registered vehicles are electric vehicles
Smart Columbus, 7-county area
  • 5% of registered vehicles use alternative fuels
  • 4% of registered vehicles are electric vehicles
  • 40% of registered vehicles use alternative fuels
  • 30% of registered vehicles are electric vehicles
OBJECTIVE: Increase the number of alternative fuel stations**
Rationale 2020 MTP Benchmark 2025 Target 2050 Target
Alternative fuel infrastructure supports the adoption of alternative fuel vehicles.
  • 96 electric vehicle charging stations
  • 53 other alternative fuel stations
US Department of Energy’s Alternative Fuel Data Center, 7-county area
  • 325 electric vehicle charging stations
  • 75 other alternative fuel stations
  • 1,500 electric vehicle charging stations
  • 150 other alternative fuel stations
*Data for the benchmark is still being gathered. **Stations can have multiple plugs
OBJECTIVE:  Reduce emissions from mobile sources to continuously meet EPA air quality standards for each criteria pollutant
Rationale 2020 MTP Benchmark 2025 Target 2050 Target
Clean air an essential natural resource and is a key indicator of a healthy community.
  • Ozone Non-Attainment
  • PM2.5 Attainment
  • Ozone Attainment
  • PM2.5 Attainment
  • Ozone Attainment
  • PM2.5 Attainment
OBJECTIVE:  Decrease the locations of freeway and expressway facilities that are at risk for flooding
Rationale 2020 MTP Benchmark 2025 Target 2050 Target
Flooding prohibits safe travel and is a result of vulnerabilities during extreme weather events.
  • 4 freeway/ expressway locations at risk for flooding
2018 ODOT Communication
  • 3 freeway /expressway locations at risk for flooding
  • 2 freeway/ expressway locations at risk for flooding

OBJECTIVE: Increase the average number of jobs reachable within 20 minutes and within 40 minutes via automobile and via transit
Rationale2020 MTP Benchmark2025 Target2050 Target
Access to jobs within reasonable travel time is important for the vitality of a region’s economy.
  • On average, 306,000 jobs reachable within 20 minutes via automobile
  • On average, 973,000 jobs reachable within 40 minutes via automobile
  • On average, 23,000 jobs reachable within 20 minutes via transit
  • On average, 102,000 jobs reachable within 40 minutes via transit

2018 Travel Demand Model

  • On average, 321,000 (5% increase) jobs reachable within 20 minutes via automobile
  • On average, 1,022,000 (5% increase) jobs reachable within 40 minutes via automobile
  • On average, 25,000 (10% increase) jobs reachable within 20 minutes via transit
  • On average, 112,000 (10% increase) jobs reachable within 40 minutes via transit
  • On average, 337,000 (10% increase) jobs reachable within 20 minutes via automobile
  • On average, 1,070,000 (10% increase) jobs reachable within 40 minutes via automobile
  • On average, 28,000 (20% increase) jobs reachable within 20 minutes via transit
  • On average, 122,000 (20% increase) jobs reachable within 40 minutes via transit
OBJECTIVE:  Minimize the percentage of total vehicle miles traveled under congested conditions
Rationale2020 MTP Benchmark2025 Target2050 Target
Efficient mobility of people and freight is an important element of a vibrant economy.
  • Total vehicle miles traveled under congested conditions:
    Daily: 5%
    Peak Periods 10.3%
  • 8.6 Annual Hours of Peak Hour Excessive Delay Per Capita

2018 Travel Demand Model on functionally classified Collectors and above, 2017 RITIS

  • Total vehicle miles traveled under congested conditions: Daily: <5%
    Peak Periods <10
  • <12 Annual Hours of Peak Hour Excessive Delay Per Capita
  • Total vehicle miles traveled under congested conditions:
    Daily: <5%
    Peak Periods <10
  • <12 Annual Hours of Peak Hour Excessive Delay Per Capita
OBJECTIVE:  Minimize the amount of extra, or buffer, travel time necessary when planning expected trip travel time.
Rationale2020 MTP Benchmark2025 Target2050 Target
Freight carriers, commuters and businesses need reliable and consistent travel times to ensure the on-time delivery of goods and most efficiently use their time.
  • AM Peak Region-wide Uncertainty Index: 1.43
  • PM Peak Region-wide Uncertainty Index: 1.55

Calculated from Jan-Dec 2017 INRIX data, arterials and above

  • 77% of Interstate System has Level of Travel Time Reliability Ratio less than federal threshold
  • 71% of non-Interstate NHS has Level of Travel Time Reliability Ratio less than federal threshold
    Truck Travel Time Reliability Index: 1.85

2018 ODOT

  • Region-wide Uncertainty Index: 1.3
  • 85% of Interstate System has Level of Travel Time Reliability Ratio less than federal threshold
  • 80% of non-Interstate NHS has Level of Travel Time Reliability Ratio less than federal threshold
  • Truck Travel Time Reliability Index: <1.5
  • Region-wide Uncertainty Index: 1.25
  • 85% of Interstate System has Level of Travel Time Reliability Ratio less than federal threshold
  • 80% of non-Interstate NHS has Level of Travel Time Reliability Ratio less than federal threshold
  • Truck Travel Time Reliability Index: <1.
OBJECTIVE: Encourage and support MORPC member communities to adopt complete streets policies or policies that contain those elements
Rationale 2020 MTP Benchmark 2025 Target 2050 Target
Complete streets allow for transportation choices, which enhance quality of life.
  • 14% of MORPC member communities have adopted complete streets policies or policies that contain those elements.
  • 20% of MORPC member communities have adopted complete streets policies or policies that contain those elements.
  • 100% of MORPC member communities have adopted complete streets policies or policies that contain those elements.
OBJECTIVE: Increase the amount of bicycle and pedestrian infrastructure
Rationale 2020 MTP Benchmark 2025 Target 2050 Target
Sustainable neighborhoods provide adequate bicycle and pedestrian infrastructure to provide viable transportation options.
  • 700 miles of bikeways 40% of arterials and collectors have sidewalks*
2018 MORPC Bikeway, Sidewalk Inventories
  • 820 miles of bikeways (17% increase)
  • 45% of arterials and collectors have sidewalks
  • 1,050 miles of bikeways (50% increase)
  • 85% of arterials and collectors have sidewalks
OBJECTIVE: Target infrastructure development to serve a higher number or people and jobs
Rationale 2020 MTP Benchmark* 2025 Target* 2050 Target*
Sustainable neighborhoods provide adequate bicycle and pedestrian infrastructure to provide viable transportation options.
  • XX% of population live within 3/4 mile of arterial or collector roadway
  • XX% of jobs are located within 3/4 mile of arterial or collector roadway
  • XX% of population live within 3/4 mile of a transit stop
  • XX% of jobs are located within 3/4 mile of a transit stop
  • XX% of population live within 3/4 mile of a bikeway
  • XX% of jobs are located within 3/4 mile of a bikeway
  • XX% of population live within 3/4 mile of arterial or collector roadway (5% increase)
  • XX% of jobs are located within 3/4 mile of arterial or collector roadway (5% increase)
  • XX% of population live within 3/4 mile of a transit stop (5% increase)
  • XX% of jobs are located within 3/4 mile of a transit stop (5% increase)
  • XX% of population live within 3/4 mile of a bikeway (5% increase)
  • XX% of jobs are located within 3/4 mile of a bikeway (5% increase)
  • XX% of population live within 3/4 mile of arterial or collector roadway (20% increase)
  • XX% of jobs are located within 3/4 mile of arterial or collector roadway (20% increase)
  • XX% of population live within 3/4 mile of a transit stop (20% increase)
  • XX% of jobs are located within 3/4 mile of a transit stop (20% increase)
  • XX% of population live within 3/4 mile of a bikeway (20% increase)
  • XX% of jobs are located within 3/4 mile of a bikeway (20% increase)
OBJECTIVE: Increase the number of bike/pedestrian miles traveled on COG trails annually
Rationale 2020 MTP Benchmark 2025 Target 2050 Target
Central Ohio Greenways (COG) are an integral component connecting sustainable neighborhoods around the region.
  • 11.5 million COG bike/pedestrian miles traveled annually (7-county area)
  • 14 million COG bike/pedestrian miles traveled annually (7-county area)
  • 25 million COG bike/pedestrian miles traveled annually (7-county area)
*Data under development
OBJECTIVE: Increase the percentage of funding from non-public sources on transportation projects on functionally classified Principal Arterials and above
Rationale 2020 MTP Benchmark 2025 Target 2050 Target
Creative funding partnerships are a result of regional collaboration and seeking out innovative solutions.
  • 0.7% of funding is from non-public sources
Projects starting FY2016-18
  • 5% of funding from non-public sources
  • 10% of funding from non-public sources
OBJECTIVE: Increase the number of projects utilizing innovative initiatives on functionally classified Principal Arterials and above
Rationale 2020 MTP Benchmark 2025 Target 2050 Target
Encourage initiatives that advance innovation and partnership to deliver and build projects efficiently.
  • 6% of projects utilized innovative initiatives
Projects completed with Every Day Counts initiatives utilized or fiber optic infrastructure included for projects 2017-2018
  • 8% of projects utilized innovative initiatives
  • 15% of projects utilized innovative initiatives
OBJECTIVE: Increase the percentage of functionally classified Minor Arterials and above facilities employing coordinated Intelligent Transportation System (ITS) technologies, and increase the percentage of all facilities that incorporate digital infrastructure.
Rationale 2020 MTP Benchmark 2025 Target 2050 Target
ITS provides for maximization of capacity on existing facilities and real-time response to incidents and security issues.
  • 20% of mileage utilizes coordinated ITS technologies
  • XX% of network incorporates digital infrastructure*
  • 30% of mileage utilizes coordinated ITS technologies
  • XX% of network incorporates digital infrastructure*
  • 90% of mileage utilizes coordinated ITS technologies
  • XX% of network incorporates digital infrastructure*
OBJECTIVE: Increase the number of transit vehicles and facilities with surveillance capabilities and increase the miles of functionally classified Principal Arterials and above with video surveillance
Rationale 2020 MTP Benchmark 2025 Target 2050 Target
Surveillance capabilities allow for real-time response to incidents and security issues.
  • 81% transit vehicles and facilities with surveillance capabilities
  • 40% of functionally classified Principal Arterials and above are under video surveillance
2017 COTA, DATAbus and ODOT Inventories
  • 90% transit vehicles and facilities with surveillance capabilities
  • 50% of functionally classified Principal Arterials and above under video surveillance
  • 100% transit vehicles and facilities with surveillance capabilities
  • 90% of functionally classified Principal Arterials and above under video surveillance
OBJECTIVE: Increase the percentage of funding from non-public sources on transportation projects on functionally classified Principal Arterials and above
Rationale 2020 MTP Benchmark 2025 Target 2050 Target
Creative funding partnerships are a result of regional collaboration and seeking out innovative solutions.
  • 0.7% of funding is from non-public sources
Projects starting FY2016-18
  • 5% of funding from non-public sources
  • 10% of funding from non-public sources
OBJECTIVE: Increase the number of projects utilizing innovative initiatives on functionally classified Principal Arterials and above
Rationale 2020 MTP Benchmark 2025 Target 2050 Target
Encourage initiatives that advance innovation and partnership to deliver and build projects efficiently.
  • 6% of projects utilized innovative initiatives
Projects completed with Every Day Counts initiatives utilized or fiber optic infrastructure included for projects 2017-2018
  • 8% of projects utilized innovative initiatives
  • 15% of projects utilized innovative initiatives
OBJECTIVE: Increase the percentage of functionally classified Minor Arterials and above facilities employing coordinated Intelligent Transportation System (ITS) technologies, and increase the percentage of all facilities that incorporate digital infrastructure.
Rationale 2020 MTP Benchmark 2025 Target 2050 Target
ITS provides for maximization of capacity on existing facilities and real-time response to incidents and security issues.
  • 20% of mileage utilizes coordinated ITS technologies
  • XX% of network incorporates digital infrastructure*
  • 30% of mileage utilizes coordinated ITS technologies
  • XX% of network incorporates digital infrastructure*
  • 90% of mileage utilizes coordinated ITS technologies
  • XX% of network incorporates digital infrastructure*
OBJECTIVE: Increase the number of transit vehicles and facilities with surveillance capabilities and increase the miles of functionally classified Principal Arterials and above with video surveillance
Rationale 2020 MTP Benchmark 2025 Target 2050 Target
Surveillance capabilities allow for real-time response to incidents and security issues.
  • 81% transit vehicles and facilities with surveillance capabilities
  • 40% of functionally classified Principal Arterials and above are under video surveillance
2017 COTA, DATAbus and ODOT Inventories
  • 90% transit vehicles and facilities with surveillance capabilities
  • 50% of functionally classified Principal Arterials and above under video surveillance
  • 100% transit vehicles and facilities with surveillance capabilities
  • 90% of functionally classified Principal Arterials and above under video surveillance
OBJECTIVE: Encourage and support MORPC member communities to adopt Smart Streets policies or policies that contain those elements
Rationale 2020 MTP Benchmark 2025 Target 2050 Target
Smart streets policies are a tool communities can use to integrate technology into transportation projects.
  • 0% of MORPC member communities have adopted smart streets policies or policies that contain those elements
  • XX% of MORPC member communities have adopted smart streets policies or policies that contain those elements*
  • XX% of MORPC member communities have adopted smart streets policies or policies that contain those elements*
*Target-setting to be informed by Smart Region Task Force recommendations, which are currently in development
OBJECTIVE: Minimize the difference in trip travel time for disadvantaged populations relative to the regional trip travel time
Rationale 2020 MTP Benchmark 2025 Target 2050 Target
The transportation system should equally serve all of the region’s population.
  • Average trip travel time for disadvantaged populations is 5% less than the regional average trip travel time
2018 Travel Demand Model
  • Average trip travel time for disadvantaged populations within 5% of regional average trip travel time
  • Average trip travel time for disadvantaged populations within 5% of regional average trip travel time
OBJECTIVE: Maintain infrastructure in a state of good repair by minimizing the percentage of bridges and pavements in poor condition and maintaining transit fleet of a useful life
Rationale 2020 MTP Benchmark 2025 Target 2050 Target
Maintenance and enhancement of existing infrastructure ensures the maximum lifespan and safe use of public investments
  • 60% of pavements of the Interstate System in Good condition
  • 0.1% of pavements of the Interstate system in Poor condition
  • 41% of pavements of the non-interstate NHS in Good condition
  • 1.3% of pavements of the non-Interstate NHS in Poor condition 2017 ODOT
  • 71% of Federal-aid non-NHS pavements in Good condition
  • 4% of Federal-aid non-NHS pavements in Poor condition
  • 77% of NHS bridge deck area classified as in Good condition
  • 1.2% of NHS bridge deck area classified as in Poor condition 2018 ODOT
  • 72% of Non-NHS bridge deck area classified as in Good condition*
  • 5% of Non-NHS bridges deck area classified as in Poor condition*
  • 12% of revenue vehicles that exceed the useful life benchmark
  • 51% of non-revenue service vehicles that exceed the useful life benchmark
  • 63% of facilities are rated less than 3.0 on the Transit Economic Requirements Model (TERM) Scale
  • >50% of pavements of the Interstate System in Good condition
  • <1% of pavements of the Interstate system in Poor condition
  • >35% of pavements of the non-interstate NHS in Good condition
  • <3% of pavements of the non-Interstate NHS in Poor condition
  • >50% of Federal-aid non-NHS pavements in Good condition
  • <5% of Federal-aid non-NHS pavements in Poor condition
  • >70% of NHS bridge deck area classified as in Good condition
  • <5% of NHS bridge deck area classified as in Poor condition
  • >60% of Non-NHS bridge deck area classified in Good condition
  • <10% of Non-NHS bridge deck area classified in Poor condition
  • 0% of revenue vehicles that exceed the useful life benchmark
  • 20% of non-revenue service vehicles that exceed the useful life benchmark
  • 25% of facilities are rated less than 3.0 on the Transit Economic Requirements Model (TERM) Scale
OBJECTIVE: Reduce the number of fatalities and serious injuries from crashes
Rationale 2020 MTP Benchmark 2025 Target 2050 Target
Crash reduction is a direct measurement of safety.
  • 0.74 fatalities per 100 million VMT
  • 6.11 serious injuries per 100 million VMT
  • Number of fatalities: 106
  • Number of serious injuries: 868
  • Number of non-motorized fatal and serious injuries: 145
Average number of crashes occurring 2013-2017
  • 0.69 fatalities per 100 million VMT
  • 5.64 serious injuries per 100 million VMT
  • 8% reduction in fatalities and serious injuries
  • 8% reduction in non-motorized fatalities and serious injuries (1% annual reduction)
  • 0.54 fatalities per 100 million VMT
  • 4.43 serious injuries per 100 million VMT
  • 27% reduction in fatalities and serious injuries
  • 27% reduction in non-motorized fatalities and serious injuries (1% annual reduction)

The objectives and performance measures can be viewed in a printable format here.

Recent Community Presentations

Presentation slides were also provided to the following:

  • City of Gahanna 3/16/20
  • City of Pataskala 3/16/20
  • South Linden Area Commission 3/17/20
  • Livingston Area Commission 3/19/20
  • North Linden Area Commission 3/19/20
  • Village of Lithopolis 3/24/20
  • Gahanna Kiwanis 4/6/20

(The COVID-19 stay-at-home order prevented in-person presentations to these groups.)

Contact Information
Maria Schaper

Sign up to receive our
News & Events

Newsletter Signup
First Name
Last Name