Apply for Residential Services
Home Repair and Weatherization programs available to help homeowners improve the safety and functionality of their homes.

Air Quality
Get alerts when air pollution levels are high in Central Ohio and how to protect your health
Gohio Commute
Find alternative commute options with Gohio Commute.

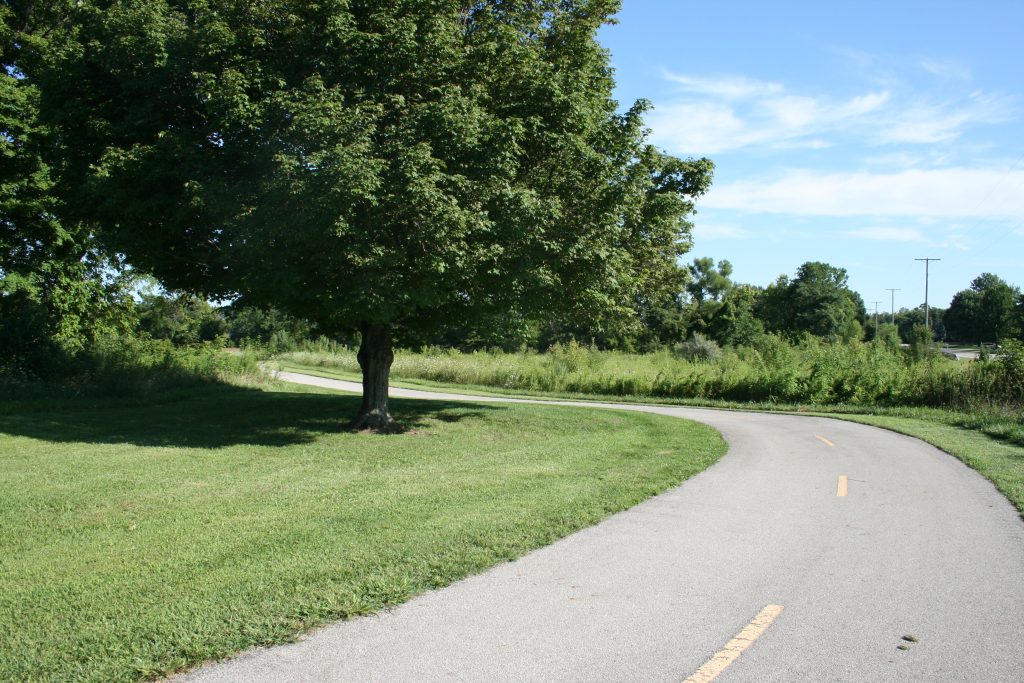
Active Transportation Plan
Planning for pedestrian, bicycle, and transit infrastructure in the region.

Drive Investment to Your Community
Unlock new opportunities and tools necessary to facilitate economic and community growth.
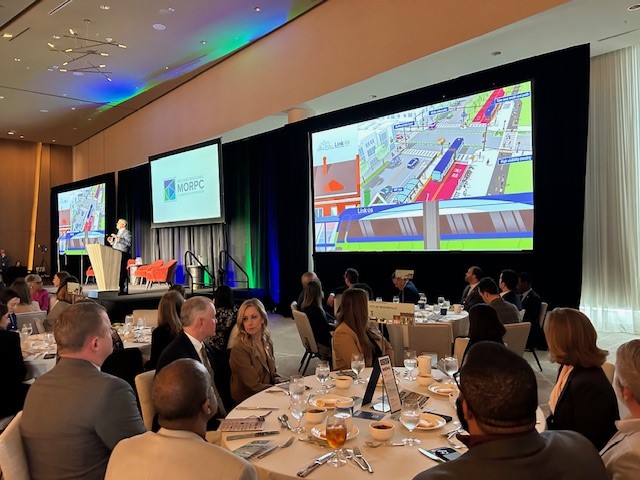
Learn more about LinkUS
A partnership among the COTA, City of Columbus, Franklin County and MORPC.
Check out the Active Transportation Plan
Find alternative commute options with Gohio Commute
Learn more about LinkUS
Apply for home repair or weatherization
Be up-to-date on federal infrastructure legislation